Usage
Graphical Interface
The best way to run the graphical interface is to simply run the following in the terminal:
astrodash
You can optionally classify a spectrum by giving a spectrum filepath, or an open supernova catalog spectrum as an argument:
astrodash -f osc-sn2002er-10
If the redshift is known, you can give this as an argument too:
astrodash -f example_spectrum.dat -z 0.2
You may also select to classify the host spectrum along with the supernova:
astrodash -f example_spectrum.dat -z 0.2 --classify_host
You may also change the amount of smoothing applied to the spectrum before it is classified. The default is 6.
astrodash -f example_spectrum.dat -z 0.2 --classify_host -s 6
The Graphical interface can also be run from a python interface with:
import astrodash
astrodash.run_gui()
If you want to quickly get started, try using an online spectrum from the open supernova catalog, by typing something like ‘osc-sn2002er-8’ in the ‘Select File’ field, then click ‘Fit with priors’!
Once the GUI is open you may follow these steps:
- Select one of the four models by ticking a combination of the ‘Known Redshift’ and ‘Classify Host’ check boxes. If Known Redshift is ticked, then the user must input a redshift. If it is unticked, then DASH will try to calculate the redshift.
- OPTIONAL. Leave Min wave and Max wave unchanged, unless you want to limit the wavelength range of the input spectrum used for classification. (For example, you may choose to do this to remove bad parts of the spectrum, or to avoid dichroic jumps)
- OPTIONAL. Changing the smooth function (minimum is 0 which means no smoothing) will change how much smoothing is applied to the spectrum before it is classified by DASH. You should generally leave this unchanged.
- OPTIONAL. Check the Calculate rlap scores if you wish to view the score (same definition from SNID). These calculations are slow.
- Browse for any single spectrum FITS, ASCII, dat, or two-column text file by clicking the ‘Browse’ button.
- Click ‘Fit with priors’ to classify.
- Click any of the best matches to view the continuum-subtracted binned spectra. You may also select a particular type, age, and host of a supernova using the combo boxes. You can set the fraction of host galaxy light in the spectrum with the slider. You may also change the redshift slider or the line on the x-corr plot to view changes in redshift.
- Once you have selected the supernova type, you may use the two arrow buttons to change the supernova template which is plotted.
The probabilities are shown for the top 20 best matches. On the top right, the probabilities of the top N matches are summed together if they are consistent with each other. This addition means that the age range will be wider even if the best fit classification has a well constrained age. It is advisable to use the smaller well constrained age as the predicted classification.
Caveats
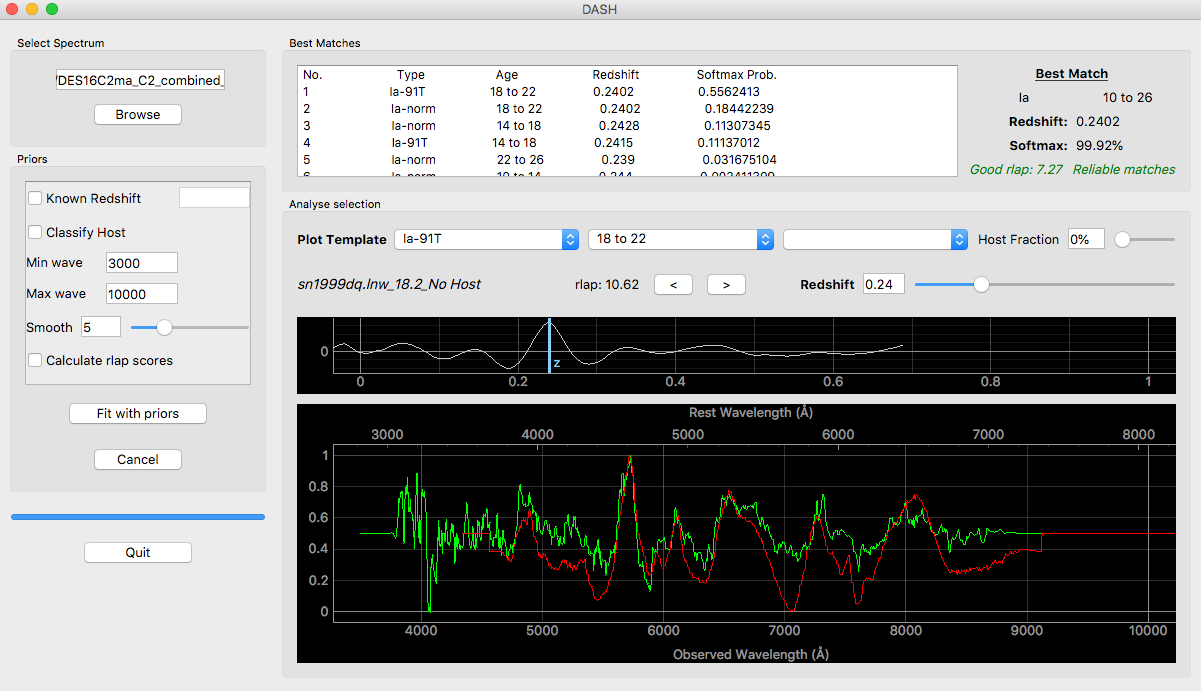
- The “Best Match” classification in the top right of the interface combines the top ranked classifications if they are in agreement. In the example above, the Best Match classification is a Ia between 10 to 26 days because the top classifications are all Ia’s between that range. The Softmax probability is then the sum of the top classifications. For a more precise classification, it is advisable to just make use of the top one (or few) classifications in the Best Matches list. Please see Appendix A.2.1 in the paper for more details (https://arxiv.org/pdf/1903.02557.pdf).
- The “Reliable matches” flag is when the top two ranked classifications are in agreement (i.e. the classifications are in neighbouring age bins of the same broad SNe type).
- rlap scores are based on the cross-correlation of the input spectrum and each of the spectra in the best matching classification bin, A score above 6 is flagged as a good rlap. Noisy or host-contaminated spectra will generally have low rlap scores.
- From experience, we have found that highly host-contaminated spectra are classified as Ic-broad type supernovae. Classifications into this subtype should generally not be trusted.
Python Library
Use the following example code:
import astrodash

classification = astrodash.Classify(filenames, knownRedshifts, classifyHost=False, knownZ=True, smooth=6, rlapScores=False)
bestFits, redshifts, bestTypes, rejectionLabels, reliableFlags, redshiftErrs = classification.list_best_matches(n=5, saveFilename='DASH_matches.txt')
classification.plot_with_gui(indexToPlot=2)
dash.Classify() takes the following arguments:
filenames: is the only mandatory argument. It must be a list of strings or file objects. Each entry contains the path to a column seperated file indicating the wavelength and flux in the first two columns respectively. ASCII or similarly formatted files are accepted. Single spectrum FITS files are also accepted. A string in the format ‘osc-name-ageidx’ may also be one of the list elements to download a spectrum from the Open Supernova Catalog; if doing this, the redshift is taken from the OSC instead of the user’s input. knownRedshifts: is an optional argument, and is a list of floats corresponding the redshifts of each of the files listed in ‘filenames’. If this argument is not included, then the redshift will be calculated by DASH. classifyHost: is an optional argument (default=False). It specifies whether DASH should try to classify the host galaxy of the supernova data file. knownZ: is an optional argument (default=True). It specifies whether DASH should try to calculate the redshift. If this is set to False, any redshift arguments given in knownRedshifts will be ignored. smooth: is an optional argument (default=6). The higher this value, the more smoothing that is applied to the spectrum. This must be an integer greater than or equal to zero. If smooth=0, then no smoothing is applied. rlapScores: is an optional argument (default=False). If this is set to True, then the rlap scores (as defined in SNID by Blondin & Tonry 2007) are calculated. This can be used as a secondary measure of confidence in the fit. Calculating the rlap scores is slow, and will increase the classification time.
To view the best matches, the ‘list_best_matches’ method takes three optional arguments:
n: (default=5) is the number of best matching classification bins to display for each spectrum. saveFilename: (default=’DASH_matches.txt’) dictates the name of the file in which to save the best matches. The saved file is the best way to view the best Matches from DASH. If this is a None type or an empty string, the best matches will not be saved to a file.
The final line is optional. It plots the 3rd spectrum onto the graphical interface.
Usage with open supernova catalogs
DASH currently allows input spectra directly from the Open Supernova Catalog. Setting the filename in the format:
osc-name-ageIndex. E.g. osc-sn2002er-10
where name is the ‘name’ of a supernova object (e.g. sn2002er) and ‘ageIndex’ is an integer index of the spectrum you wish to use from the open supernova catalog (e.g. 10).
You may input this format into the graphical interface or as a string in the list of filenames in the python interface.
Notes on performance
In many cases DASH will classify a spectrum that has a lot of host-galaxy contamination as a Ic-broad type. We suggest that users consider that the Ic-broad prediction is more likely to just be a host-contaminated spectrum.