Usage
Graphical Interface
There are three ways to open the graphical interface:
- Run the following in the terminal:
astrodash
OR
- Open a python interpreter and run the following:
import astrodash
astrodash.run_gui()
OR
- Run the following in the terminal:
python $INSTALL_DIR/gui_main.py
(Where $INSTALL_DIR is the directory where DASH has been installed.)
If you want to quickly get started, try using an online spectrum from the open supernova catalog, by typeing something like ‘osc-sn2002er-10’ in the ‘Select File’ field, then click ‘Re-fit’!
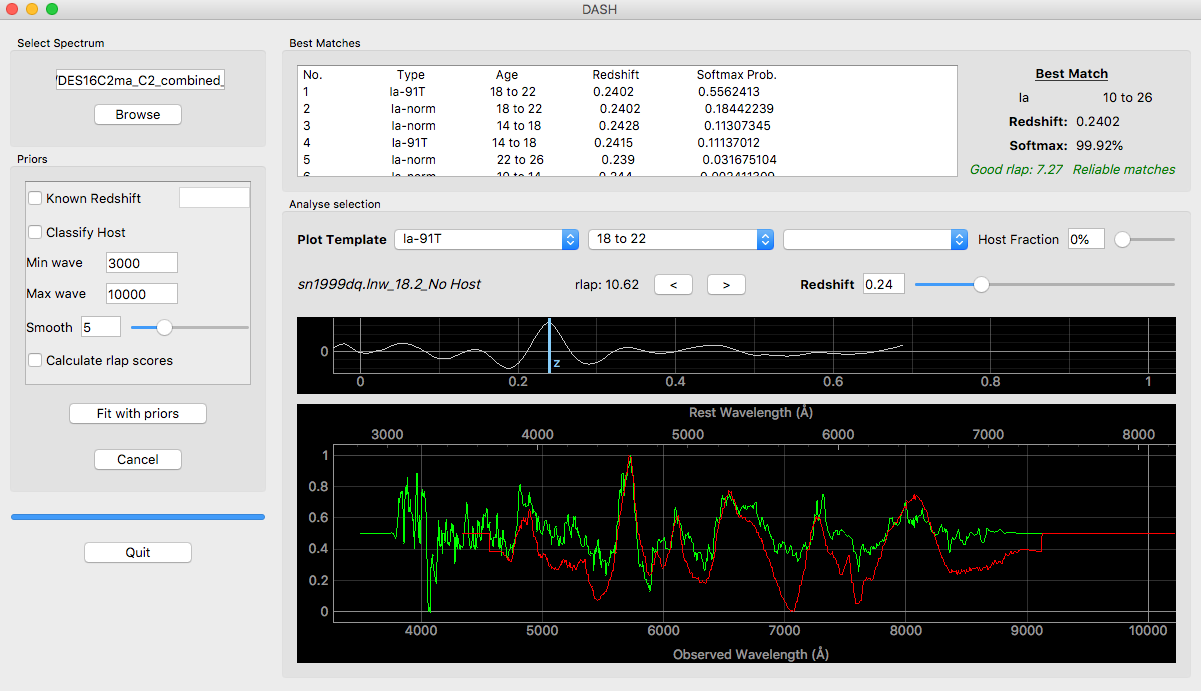
Once the GUI is open you may follow these steps:
- Select one of the four models by ticking a combination of the ‘Known Redshift’ and ‘Classify Host’ check boxes. If Known Redshift is ticked, then the user must input a redshift. If it is unticked, then DASH will try to calculate the redshift.
- OPTIONAL. Leave Min wave and Max wave unchanged, unless you want to limit the wavelength range of the input spectrum used for classification. (For example, you may choose to do this to remove bad parts of the spectrum, or to avoid dichroic jumps)
- OPTIONAL. Changing the smooth function (minimum is 0 which means no smoothing) will change how much smoothing is applied to the spectrum before it is classified by DASH. You should generally leave this unchanged.
- OPTIONAL. Check the Calculate rlap scores if you wish to view the score (same definition from SNID). These calculations are slow.
- Browse for any single spectrum FITS, ASCII, dat, or two-column text file by clicking the ‘Browse’ button.
- Click ‘Re-fit with priors’ to classify.
- Click any of the best matches to view the continuum-subtracted binned spectra. You may also select a particular type, age, and host of a supernova using the combo boxes. You can set the fraction of host galaxy light in the spectrum with the slider. You may also change the redshift slider or the line on the x-corr plot to view changes in redshift.
- Once you have selected the supernova type, you may use the two arrow buttons to change the supernova template which is plotted.
Python Library
Use the following example code:
import astrodash

classification = astrodash.Classify(filenames, knownRedshifts, classifyHost=False, knownZ=True, smooth=6, rlapScores=False)
bestFits, redshifts, bestTypes, rejectionLabels, reliableFlags = classification.list_best_matches(n=5, saveFilename='DASH_matches.txt')
classification.plot_with_gui(indexToPlot=2)
dash.Classify() takes the following arguments:
filenames: is the only mandatory argument. It must be a list of strings of the supernova data files. Column seperated .dat, ASCII, or similarly formatted files are accepted. Single spectrum FITS files are also accepted. knownRedshifts: is an optional argument, and is a list of floats corresponding the redshifts of each of the files listed in ‘filenames’. If this argument is not included, then the redshift will be calculated by DASH. classifyHost: is an optional argument (default=False). It specifies whether DASH should try to classify the host galaxy of the supernova data file. knownZ: is an optional argument (default=True). It specifies whether DASH should try to calculate the redshift. If this is set to False, any redshift arguments given in knownRedshifts will be ignored. smooth: is an optional argument (default=6). The higher this value, the more smoothing that is applied to the spectrum. This must be an integer greater than or equal to zero. If smooth=0, then no smoothing is applied. rlapScores: is an optional argument (default=False). If this is set to True, then the rlap scores (as defined in SNID by Blondin & Tonry 2007) are calculated. This can be used as a secondary measure of confidence in the fit. Calculating the rlap scores is slow, and will increase the classification time.
To view the best matches, the ‘list_best_matches’ method takes three optional arguments:
n: (default=5) is the number of best matching classification bins to display for each spectrum. saveFilename: (default=’DASH_matches.txt’) dictates the name of the file in which to save the best matches. The saved file is the best way to view the best Matches from DASH. If this is a None type or an empty string, the best matches will not be saved to a file.
The final line is optional. It plots the 3rd spectrum onto the graphical interface.
Usage with open supernova catalogs
DASH currently allows input spectra directly from the Open Supernova Catalog <https://sne.space/>. Setting the filename in the format:
osc-name-ageIndex. E.g. osc-sn2002er-10
where name is the ‘name’ of a supernova object (e.g. sn2002er) and ‘ageIndex’ is an integer index of the spectrum you wish to use from the open supernova catalog (e.g. 10).
You may input this format into the graphical interface or as a string in the list of filenames in the python interface.